Statistics are handy to understand the state of the world, and, within it, there are four main statistical measures that one should know: mean, median, mode, and range. Thus, we have included an online calculator for the mean, median, mode, and range in this article so that you can learn step by step and in a simple way how to obtain these values.
Mean, Median, Mode and Range Calculator
What is the Mean?
The mean is a measure of central tendency that represents the average of a set of numbers.
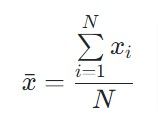
The mean can be arithmetic, geometric or harmonic. For our calculator, when we talk about mean, we will refer to the arithmetic mean. It is obtained by dividing the sum of the values by the number of values:
If you want to calculate another type of mean, you can check our publications:
What is the Median?
The median is the value in the middle of a set of values ordered from smallest to largest. The median divides the set of numbers with the same number of values on both sides.
The first step in calculating the median is to order the values from smallest to largest. Then it will be calculated depending on whether the number of elements is even or odd.
- If the number of elements is odd, the median is the value found in the position (n+1)/2, where “n” is the number of elements in the set.
- If the number of elements is even, the median is the semisum of the two central values. The position of these values is (n/2) and (n/2)+1.
What is Mode?
The mode is a measure of central tendency that represents the value with the highest absolute frequency in a data set.
If we have two values with the maximum absolute frequency in the data set, it is considered a bimodal distribution. If it has more than three or more values with the maximum frequency, it is multimodal.
If the set of values has the same frequency for all its elements, the distribution is considered to have no mode.
What is the Range?
The range is the value that represents the difference between the maximum and minimum values of a set of data.
The range is also known as the amplitude or range of measurement.
How to use the online mean, median, mode, and range calculator?
Our online tool has a very easy-to-use interface; however, we will explain how to use it step by step for those who have any doubts. It is worth mentioning that this application is oriented to solve exercises of non-grouped data.
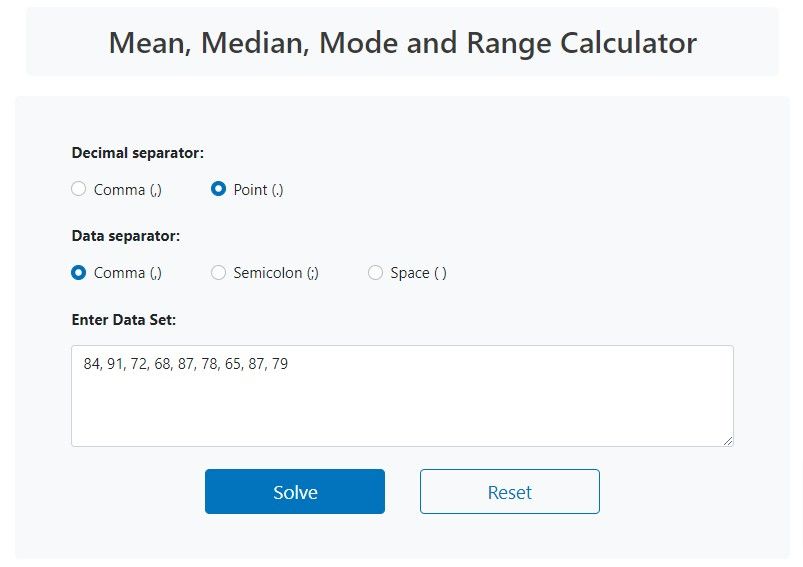
- Select the option of your preference for the decimal separator and the data separator.
- Enter the data that we will use to calculate the mean, median, mode, and range. If there is an error in the data entry, a message will be displayed at the bottom. You should not use line breaks.
- Click on solve.
- Then, you will be able to see the details of the calculations performed.
Next, we will solve an example:
Example
For the following set of values, calculate the mean, median, mode, and range:
84, 91, 72, 68, 87, 78, 65, 87, 79
Solution
Enter the data set in the form:
When clicking on “Solve” we will obtain the following:
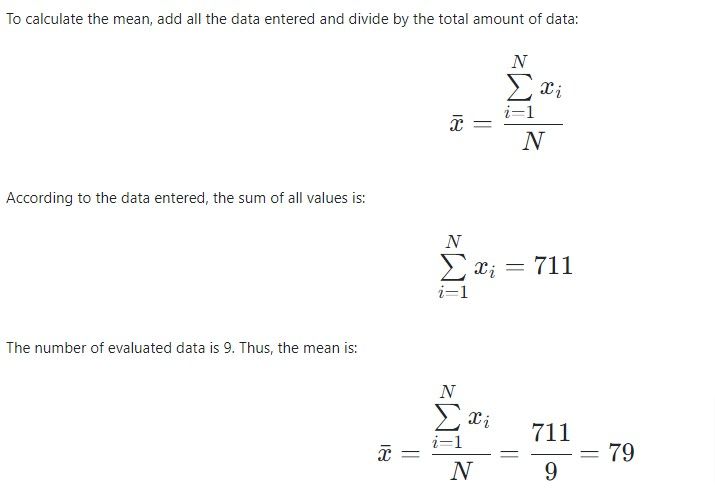
Mean: 79
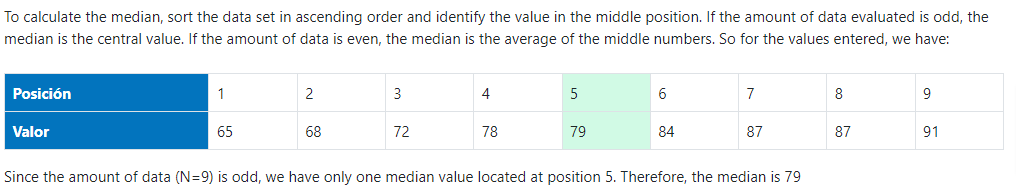
Median: 79
Mode: 87
Maximum Value: 91
Minimum Value: 65
Range: 26
Count of Data: 9
a) Calculation of the Mean
b) Calculation of the Median
c) Calculation of the Mode

d) Calculation of the Range
The range of a data set in statistics is the difference between the minimum and maximum values. For this case, we have:
- Minimum value: 65.
- Maximum value: 91.
- Range: 91 – 65 = 26.
You can also find the “Copy link to share results” button to get the link to share the exercises you develop with a colleague or save it in your file. You can also calculate other measures of data dispersion with our:
Final Reflection
As mentioned at the beginning of the article, the three most common ways of measuring data are the mean, median, and mode. Likewise, the range is an essential measure of dispersion to determine the amplitude of the values. With our online calculator, you will be able to go deeper and understand these concepts more quickly.

Pingback: finasteride dog prostate
Pingback: sildenafil citrate pronounce in english
Pingback: acyclovir stada 5 cream 5g
Pingback: toradol short term therapy guide
Pingback: ivermectin clinical FAQ
Pingback: minoxidil structured guide
Pingback: vardenafil 5 mg reference
Pingback: vardenafil safety warnings overview