Many students and professionals who need to calculate the probability within a normal distribution have many doubts about how to perform the Gaussian bell, shading the area, in addition to the tedious task of reviewing the statistical table to find the corresponding value. In that sense, in PM Calculators, we have developed a normal distribution and probability calculator online where you can solve the classic exercises presented in the statistics books on this topic.
Normal Distribution Calculator
The free version of this application is instrumental in confirming the results we obtain when solving a problem manually. However, to fully understand how the results are calculated step by step and the use of the statistical table of standard distribution Z, you can log in to our membership and get access to our premium tools that include two calculators to work with the normal distribution.
Advanced features of the Online Normal Distribution Calculator
Considering the most used books on normal distribution in management and engineering, we have developed our application oriented to a step-by-step explanation of the calculation procedure.
Among the functions you will find we have:
- Explanation of the passage of the random variable to the standard normal distribution Z ~ N(0,1).
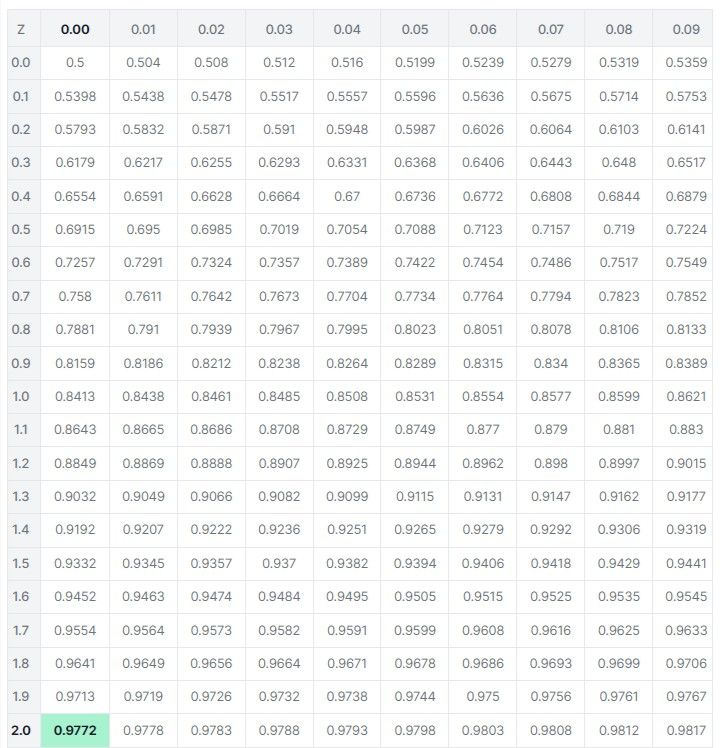
- Use the lower-tailed standard normal distribution table Z and make the necessary adjustments to obtain the result.
- Possibility to calculate the probability and the limit of the random variable (inverse normal distribution).
- Graphing the Gaussian bell for both the evaluated random variable and the standard normal distribution.
You can find examples of its operation at this link.
How to use the Normal Distribution and Probability calculator
To use our calculator, you must do the following:
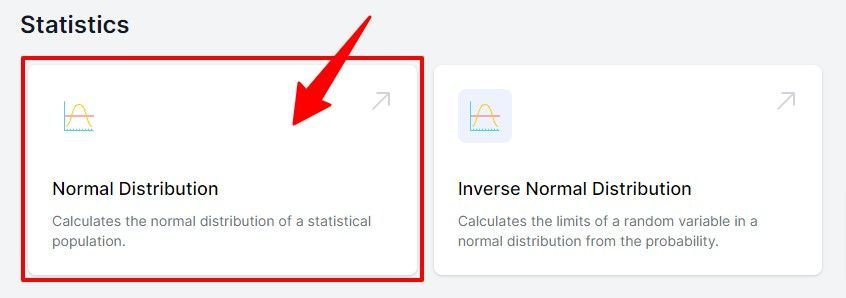
- Define whether you need to calculate the probability or the limit of the random variable given a probability.
- Enter the data of the problem:
- Mean: It is the average value of the data set that conforms to the normal distribution.
- Standard Deviation: The value quantifies the variation or dispersion of the data set to be evaluated. In some exercises, instead of giving you the standard deviation, they give you the variance. In those cases, you must remember that the standard deviation is equal to the square root of the variance.
- Calculate: Here, we must select the type of problem we are going to solve. We have the option to calculate the probability that our variable is less, greater, inside or outside specific values, or the option to calculate the value that corresponds to a given probability. This last option refers to the inverse normal distribution.
- Values: If you selected the normal distribution calculator, you must enter the values you want to calculate the probability. You can see a classic problem of this type in Example 1.
- Probability: If you selected the inverse normal distribution calculator, you enter the probability given by the exercise, depending on whether it is the upper or lower tail. The value to enter in these boxes must be between 0 and 1. We have a solved exercise of this case in example 2.
- Once you have entered all the data, click on Solve.
- The calculator will show us the standard curve, the corresponding area under the normal curve, and the results according to the chosen option. If you use the membership version, you will be able to visualize the step-by-step. The obtained graphs can be downloaded to your computer.
Here are two examples of how to use the calculator in the full version:
Example 1 – Normal Distribution
A customer has an investment portfolio whose mean value is $500,000 and whose standard deviation is $15,000. You have asked him to calculate the probability that the value of his portfolio is between $485 000 and $530 000:
Solution 1:
Since we are looking to calculate the probability, we will select the normal distribution calculator and record the values:
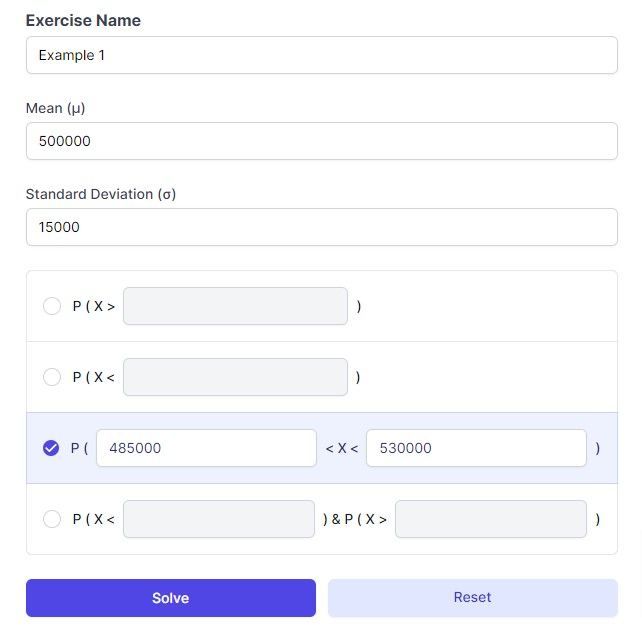
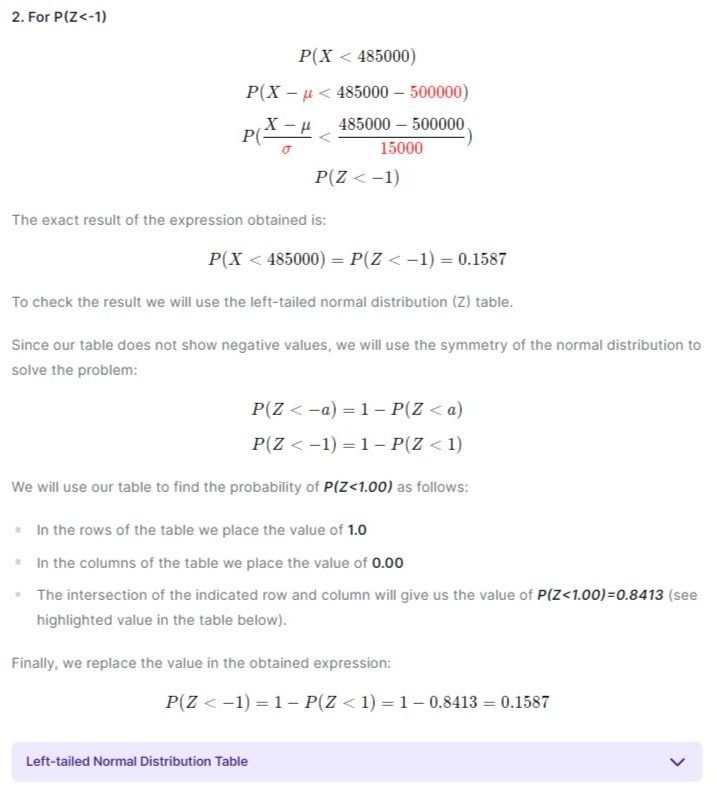
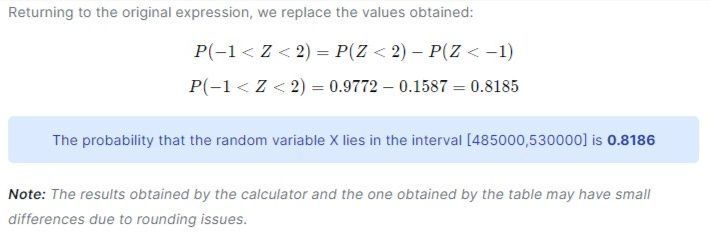
Clicking on solve will display the results as follows:
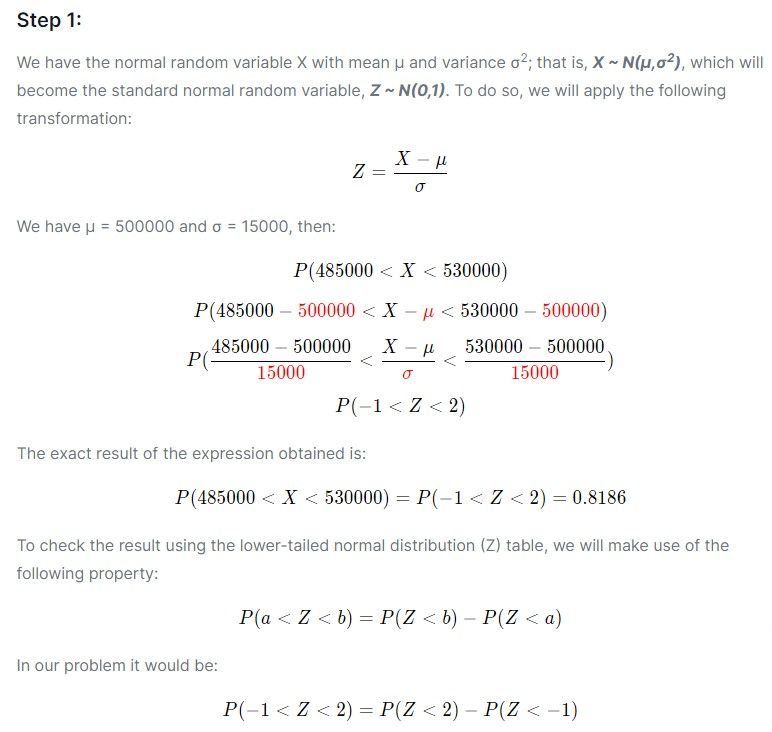
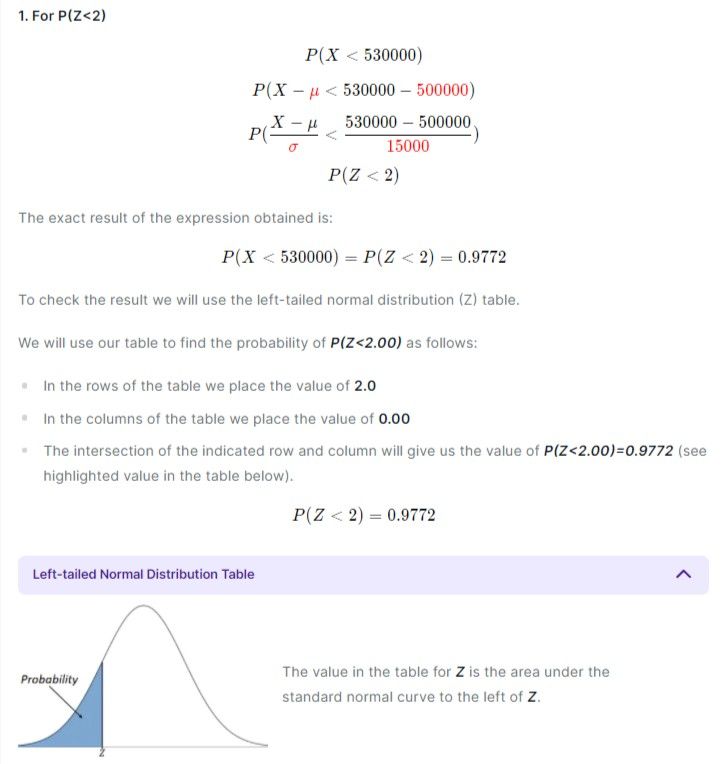
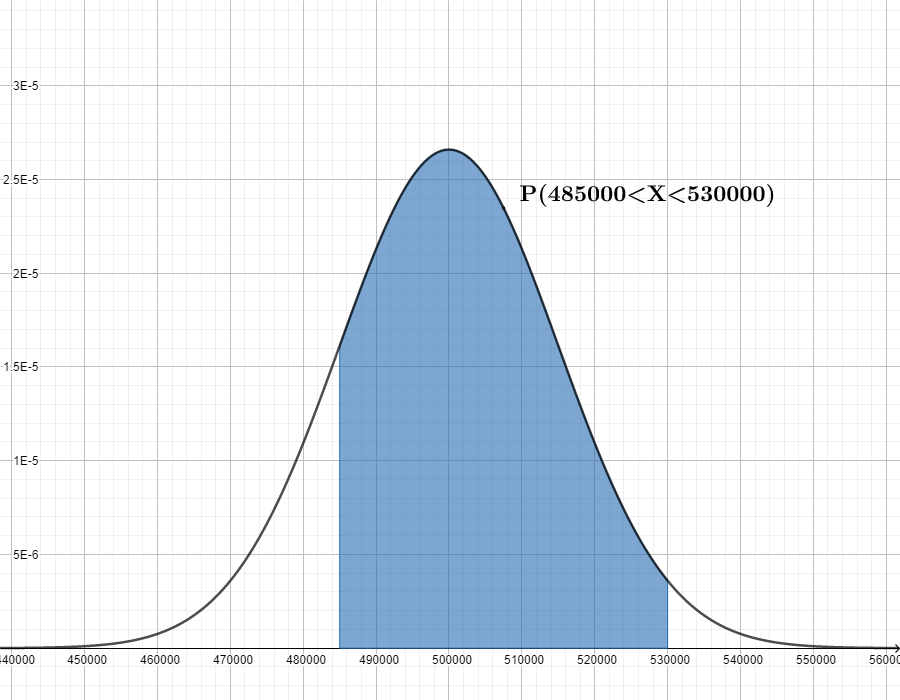
The graphs of the standard normal distribution and the random variable evaluated are:
Example 2 – Inverse Normal Distribution
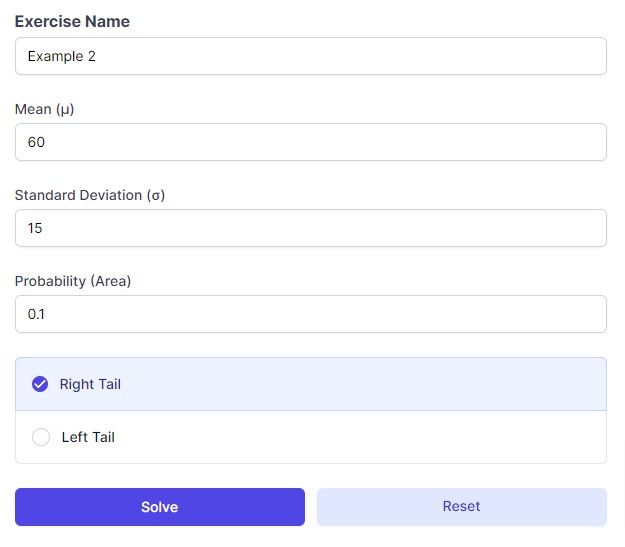
A huge group of students obtain grades (from 0 to 100) that follow a normal distribution having a mean of 60 and a standard deviation of 15. Find the cutoff point of the top 10 percent of all students.
Solution 2:
We enter the data in the calculator as indicated by the exercise. We will use the inverse normal distribution calculator since we are asked to calculate the cut-off point for a right tail probability of 0.10 (10%):
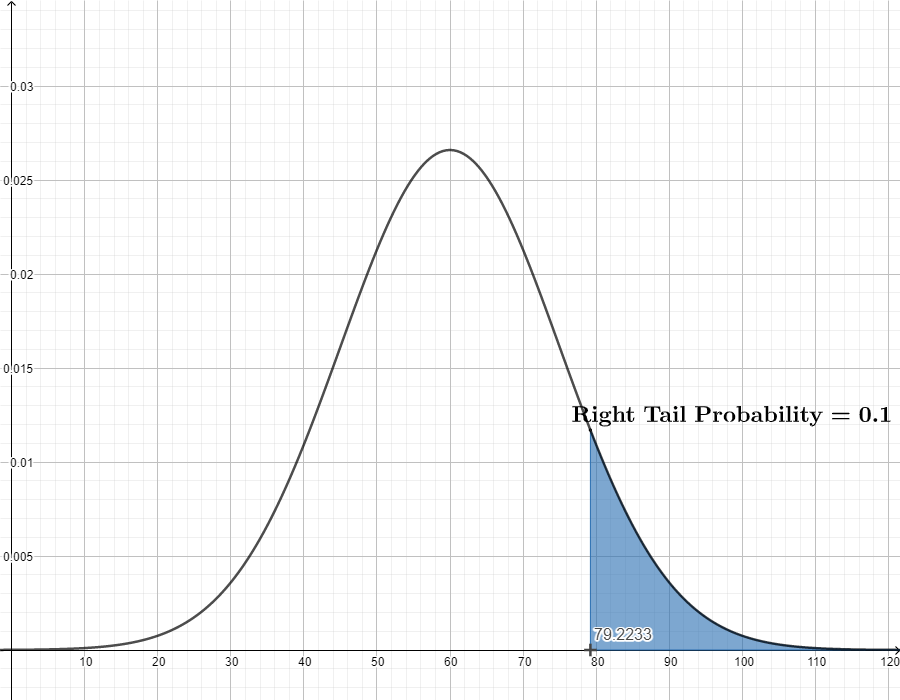
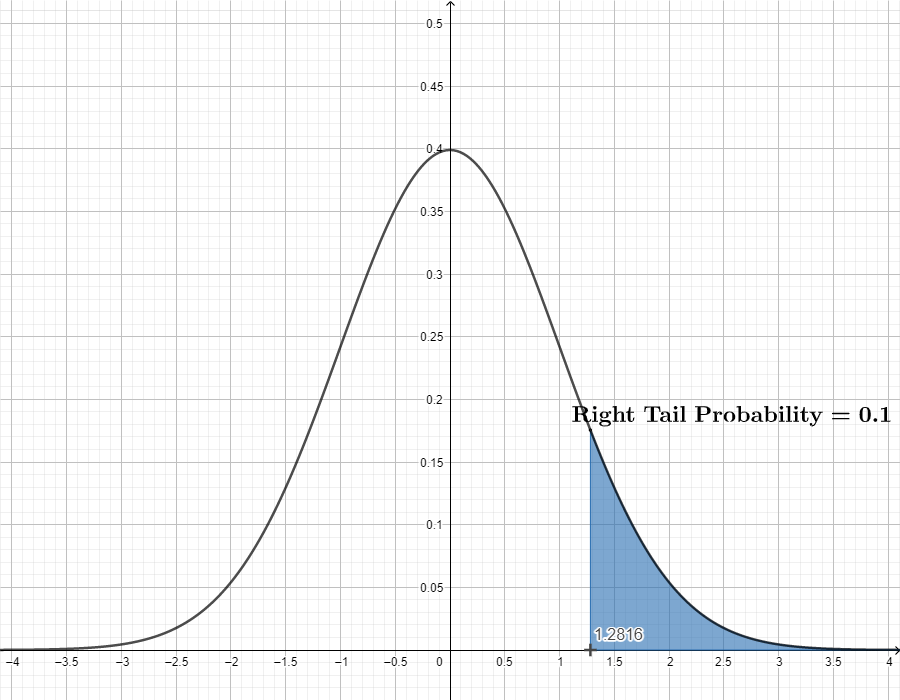
The results would look as follows (only the final part is shown since the procedure is similar to the previous example):

The charts would be:
Final Reflection
The normal distribution, also known as the Gaussian bell, is a continuous probability distribution that is very important in statistics and many other disciplines such as engineering, finance, and others. With our normal distribution calculator, you can better learn how to solve problems related to this topic.

Pingback: sildenafil citrate moa
Pingback: sildenafil 20mg cost
Pingback: dutasteride online buy
Pingback: semaglutid vs mounjaro
Pingback: semaglutid spritze wegovy
Pingback: erly liraglutide injection uses
Pingback: ivermectin rosacea peer‑reviewed data
Pingback: minoxidil clinical documentation
Pingback: minoxidil onset study
Pingback: minoxidil metabolism overview
Pingback: minoxidil women’s pk overview
Pingback: sildenafil smooth muscle relaxation
Pingback: avanafil nitrate contraindications
Pingback: avanafil mechanism context
Pingback: orlistat contraindication summary