If you need to create a schedule quickly and easily, here, you will find an excellent tool for doing it: Gantt Chart Online Maker Free without registration.
Our Online Gantt Chart application is free, easy to use, and comes with different configurations according to your use case. Best of all, it does not require you to register or sign up on our website, and you can use it immediately.
Simple Gantt Chart Online
How to create a simple Gantt Chart Online Free
To make the Gantt Chart Online, you must follow these simple steps:
- Select the data to use to generate our graph:
- Method to enter the time of the activities: enter the start date and end date, or enter the start date and duration.
- Time unit. They enable it only when you select “start date and duration” in the previous point. The units of time available are hours, days, weeks, and months (30 days).
- Relationship between activities. It shows if the exercise includes related activities.
- According to the choices made, the table will be generated where the data will be entered. The calculator accepts up to 50 activities.
- We can enter durations in decimal numbers or fractions. For example, 1 hour 30 minutes, I can enter it as 1.5 hours.
- Click on the graph to view our Gantt chart.
- You can change the graph directly by dragging the progress percentage and the duration of the activity.
- You can adjust the graph view by selecting the buttons at the bottom.
- At the bottom will be shown the data of the project's start date, end, and total duration.
- You can also download the Gantt chart in the “Save Image” button.
Relationship between the start date, end date, and duration:
It is important to explain the relationship of the start date, end date, and duration to understand how the application performs the calculations. The existing relationship is:
End Date = Start Date + Duration
In this way, for example, if an activity has a start date = 01/15/2021 00:00 and has a duration of 1 day. The end date would be = 01/16/2021 00:00.
When we work with hours, we can select the exact date and time each activity starts. 00:00 hours will be taken as the start time when choosing the date for the other time units.
Example:
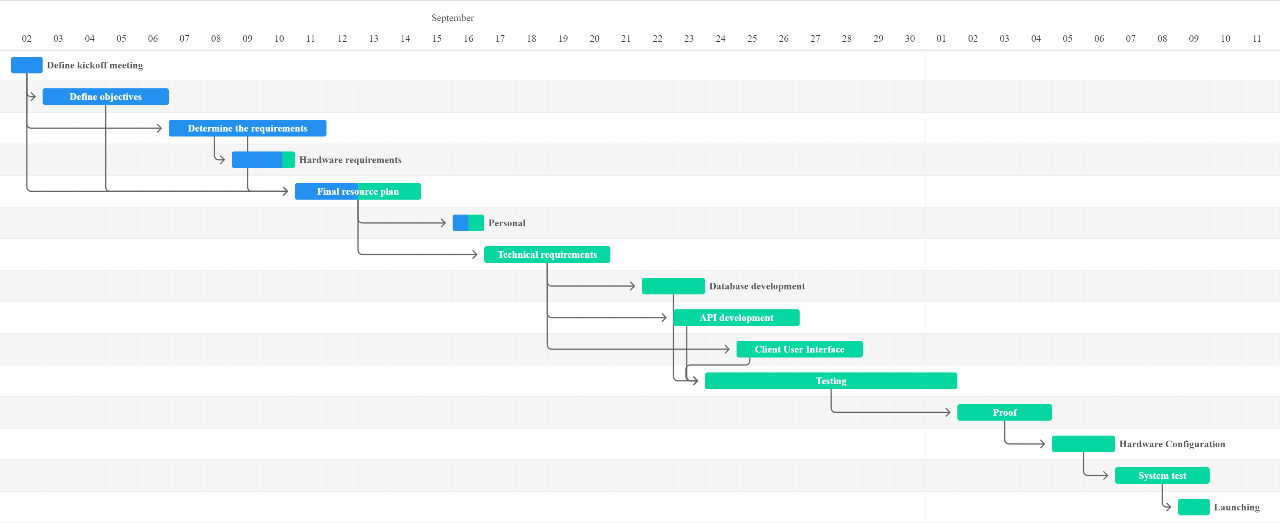
Make a Gantt chart with the following data:
| Activity | Description | Start Date | Duration (days) | Advance | Immediate precedents |
| A | Define kickoff meeting | 09/02/2020 | 1 | 100% | – |
| B | Define objectives | 09/03/2020 | 4 | 100% | A |
| C | Determine the requirements | 09/07/2020 | 5 | 100% | A |
| D | Hardware requirements | 09/09/2020 | 2 | 80% | C |
| E | Final resource plan | 09/11/2020 | 4 | 50% | A,B,C |
| F | Personal | 09/16/2020 | 1 | 50% | E |
| G | Technical requirements | 09/17/2020 | 4 | 0% | E |
| H | Database development | 09/22/2020 | 2 | 0% | G |
| I | API development | 09/23/2020 | 4 | 0% | G |
| J | Client User Interface | 09/25/2020 | 4 | 0% | G |
| K | Testing | 09/24/2020 | 8 | 0% | H,I,J |
| L | Proof | 10/02/2020 | 3 | 0% | K |
| M | Hardware Configuration | 10/05/2020 | 2 | 0% | L |
| N | System test | 10/07/2020 | 3 | 0% | M |
| O | Launching | 10/09/2020 | 1 | 0% | N |
Solution
Entering all the data, our Gantt chart would look like this:
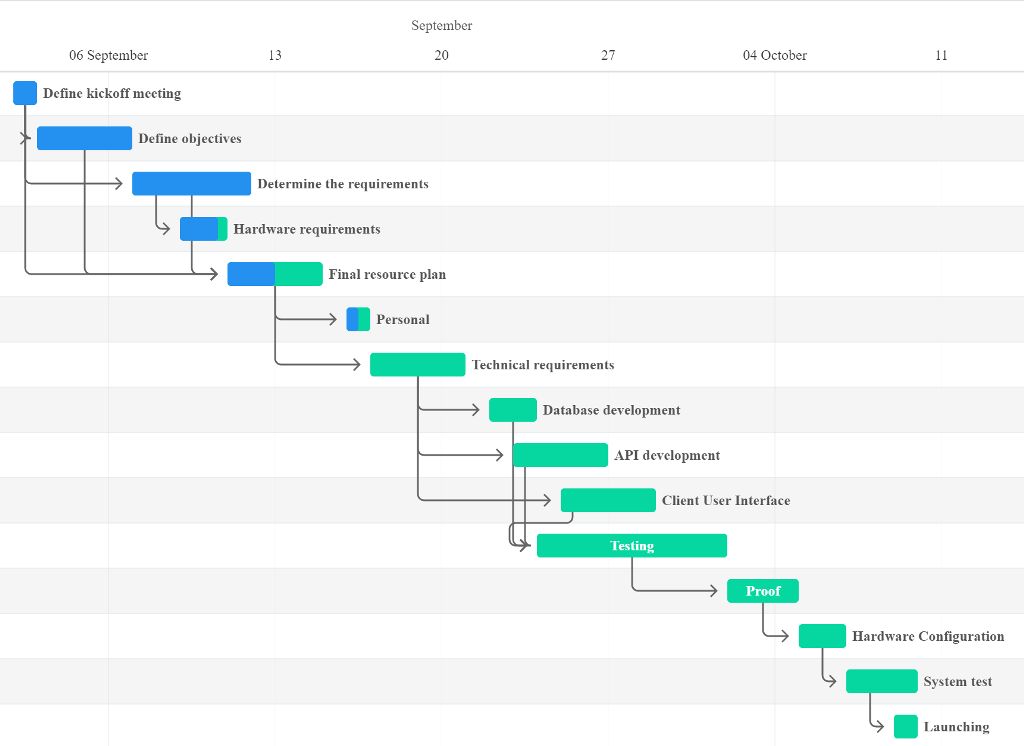
Remember that you can change the view of the diagram with the buttons at the bottom. This is how the weekly view would be:
Final reflection
A project management tool is a great way to plan, schedule, and organize your work, so from now on, you will be able to create Gantt charts online for free in a matter of minutes with no sign up, thanks to our application.
